2021/12/31

Statistics: Covariance 共變異數

對於X和Y兩個隨機變數(random variables),要判斷二者是否有線性關係,可以使用:

1. Covariance 共變異數

2. Correlation Coefficient 相關係數

Covariance 共變異數

對於一個母體的共變異數可表示為σXY = cov(X, Y)

維基百科的圖很清楚地說明,cov(X, Y) > 0 時為正相關,cov(X, Y) < 0時為負相關

cov(X, Y) = E { [X - E(X)] [Y - E(Y)] } = E [ (X - μX) (Y - μX) ] = E(XY) - μXμY

對於散佈圖(Scater Plot)上的點來說,每個點是成對的座標值(xi, yi)

X的變異數是Σ(Xi -μX)2/N,Y的變異數則是Σ(Yi -μY)2/N

因此,X和Y的共變異數是Σ(Xi -μX)(Yi -μY)/N

換句話說,共變異數是每個點的X座標Xi與平均值μX的差,乘以每個點的Y座標Yi與平均值μY的差,相乘後每個點得到一個乘積,再將這N個積加總,最後除以N

===

母體相關係數

ρXY = cov(X, Y)/σXσ= σXYXσY

X和Y的相關係數是二者的共變異數除以二者標準差的積σXσY

參考資料

Covariance (Wikipedia) / 共變異數 (維基百科)

統計學:觀念、理論與方法(二版),賀力行、林淑萍、蔡明春,前程企業,民90,43-47頁

2021/7/16

Tukey, Software, Bit, and FFT

John Tukey (1915-2000)

約翰‧圖基(杜凱)是知名的數學家,在使用統計學的ANOVA(變異數分析)時,很常會用到Tukey post hoc test (事後檢定)。

John Tukey.jpg

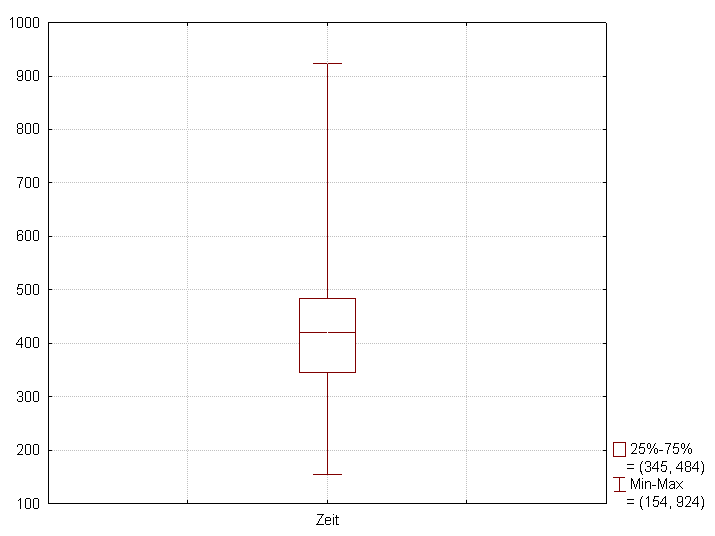
在統計學領域,Tukey有許多貢獻,例如盒狀圖(box plot),或稱為盒鬚圖(box-and-whisker plot)。

Box-Plot mit Min-Max Abstand.png

https://en.wikipedia.org/wiki/Box_plot


除了統計學,Tukey還有許多特別的貢獻,例如他發明了資訊方面的新字「Software」(軟體)和「bit」(位元)。

此外,對於訊號處理領域知名的快速傅利葉轉換(Fast Fourier Transform, FFT)來說,Tukey和庫利(James William Cooley, 1926-2016)一起提出了Cooley-Tukey FFT algorithm,是一大貢獻。

統計學家可以與不同領域的學者交流,透過花時間溝通與了解,幫助他們解決統計方面的問題,因此Tukey有一句名言

"The best thing about being a statistician is that you get to play in everyone’s backyard."
作為一名統計學家最棒的一件事,就是你可以去每個人的後院玩耍。

參考資料:

John Wilder Tukey 1973 | National Medal of Science - Mathematics And Computer Science

2021/7/12

Statistics 這個英文字不只是統計學?也是統計量!

談到統計學,對應的英文字自然是Statistics。如果你與我一樣,在讀英文的統計學時讀到Statistics這個字,可是從上下文看來,它指的不是學科、不是統計學這個領域,然後百思不得其解🙄

恭喜你發現英文世界的奧妙!😄 Statistics不只是統計學!

STATISTICS 也可以是統計量!

哇,這樣不是很容易搞混意思嗎?沒錯!所以看英文時要掌握文章脈絡(context,上下文),特別是單複數型態。

先從單數型態來看,statistic這個字是一個統計量(統計值),是可數的,因此它不只可以是一個,也可以是兩個、三個、多個,所以在複數型態時要加上s,因此,就變成了statistics,表示兩個以上的統計量!

所以,單數的statistic前面要加a表示一個,而文法上是單數型態,而statistics則數複數型態,例如:

A statistic is a random variable. (一個統計量是一個隨機變數)

Properties of statistics include completeness, consistency, sufficiency, ... (統計量的屬性包括了完備性、一致性、充分性...) (改自Wikipedia)

回到統計學的部分,就如同其他學科,後面接的字是第三人稱單數型態的be動詞或動詞(加s),例如:

Statistics is a science of analysis (統計學是分析的科學)
Statistics deals with data. (統計學處理著資料)

所以,statistic是只統計量,而statstics除了看上下文,只要清楚句子中的動詞,複數的話就是指好幾個統就量,單數的話通常是指統計學,如此一來,這兩種中文的意思就不難分辨囉!

最後稍微介紹一下統計量,由於統計量是用在統計而不是普查,因此不是直接用在母體(population),而是用在樣本。根據維基百科,統計量就是樣本統計量(sample statistic)

舉例來說,樣本平均數x̅,就是一個統計量。

關於統計量的更多介紹,未來有機會再整理,這個分享就先到這邊囉~

References:

Statistic (Wikipedia)

Basic Statistical Terms 統計學基本名詞 (StudyBME)

2021/3/11

Taxonomic rank 生物分類階元

小時候讀過「界門綱目科屬種」,是林奈體系(Linnaeu's System)的生物分類法(Taxonomic rank),對照英文,原來是這樣:

界 (Kingdom)
門(動物 Phylum/ 植物 Division)
綱(Class)
目(Order)
科(Family)
屬(Genus)
種(Species)

Biological classification L Pengo vflip      Biological classification L Pengo vflip zh


strain 分型 (Wikipedia)

References:

界門綱目科屬種的英文? (Yahoo知識+)

2020/9/21

R Programming Language - Run R Script

To run R script, install RStudio.

Add a new R script file and save it as a *.R file.


The code in the new script file can be:

a = 1

b = 2

a+b

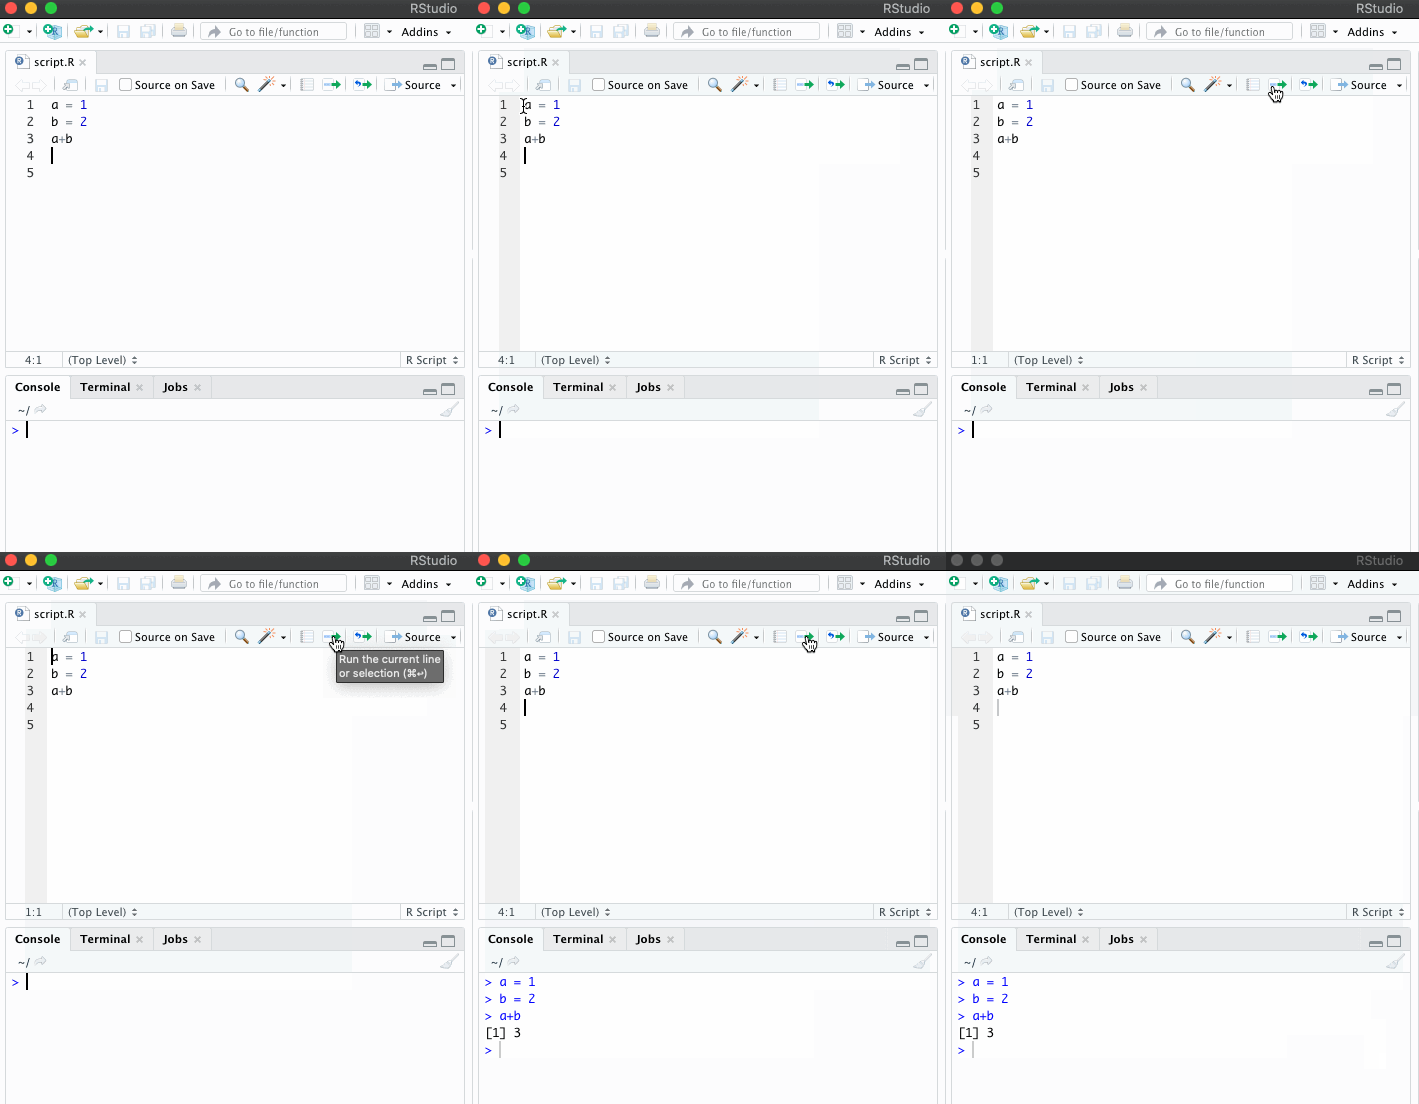
When executing the script file, move the cursor to the first line of the script.

Press the run button, one line is run and the cursor is moved to the next line.

In the above example, press the run button three time for the three lines as below:


Related Information:

Installation and basic R commands

R programming language - load and save data

2020/9/3

R programming language - load and save data

This article explains the commands to load and save R data.

Firstly, declare data x:

    x = c(1,2,3,4,5,6)

Get the local path: getwd()

    path = getwd()

Change path:

    pathnew = file.path(path,"Desktop")

Set the local path: setwd()

    setwd(pathnew)

Save

    filename = file.path(pathnew,"test.RData")

    save(x,file=filename)

Clear workplace

    rm(list=ls())

Load

    filename = file.path(getwd(),"test.RData")

    load(filename)

    > x

    [1] 1 2 3 4 5 6

Related Information:

How to save and run an R Script

Installation and basic R commands

2020/8/18

Installation and Basic R commands

The R Project for Statistical Computing software is available with multiple operating systems such as Windows, MacOS.

It may be downloaded here:

https://www.r-project.org

After installation, try declare values with '=' or '<-' and see the average result with 'mean' function.

> x<-c(1,2,3,4,5)

> mean(x)

[1] 3

> y<-c(2,3,4,5,6,7,8)

> mean(y)

[1] 5

> z=c(5,6,7)

> mean(z)

[1] 6

Result:

To remove the above warning messages, open terminal and type:

defaults write org.R-project.R force.LANG en_US.UTF-8

Reference:

[記宅] 在 Mac 上安裝 R 語言 (R Studio, R) 新手介紹

Related Information:

R programming language - load and save data

How to save and run an R Script