顯示具有 statistics 標籤的文章。 顯示所有文章

2021/12/31

Statistics: Covariance 共變異數

對於X和Y兩個隨機變數(random variables),要判斷二者是否有線性關係,可以使用:

1. Covariance 共變異數

2. Correlation Coefficient 相關係數

Covariance 共變異數

對於一個母體的共變異數可表示為σXY = cov(X, Y)

維基百科的圖很清楚地說明,cov(X, Y) > 0 時為正相關,cov(X, Y) < 0時為負相關

cov(X, Y) = E { [X - E(X)] [Y - E(Y)] } = E [ (X - μX) (Y - μX) ] = E(XY) - μXμY

對於散佈圖(Scater Plot)上的點來說,每個點是成對的座標值(xi, yi)

X的變異數是Σ(Xi -μX)2/N,Y的變異數則是Σ(Yi -μY)2/N

因此,X和Y的共變異數是Σ(Xi -μX)(Yi -μY)/N

換句話說,共變異數是每個點的X座標Xi與平均值μX的差,乘以每個點的Y座標Yi與平均值μY的差,相乘後每個點得到一個乘積,再將這N個積加總,最後除以N

===

母體相關係數

ρXY = cov(X, Y)/σXσ= σXYXσY

X和Y的相關係數是二者的共變異數除以二者標準差的積σXσY

參考資料

Covariance (Wikipedia) / 共變異數 (維基百科)

統計學:觀念、理論與方法(二版),賀力行、林淑萍、蔡明春,前程企業,民90,43-47頁

2021/7/16

Tukey, Software, Bit, and FFT

John Tukey (1915-2000)

約翰‧圖基(杜凱)是知名的數學家,在使用統計學的ANOVA(變異數分析)時,很常會用到Tukey post hoc test (事後檢定)。

John Tukey.jpg

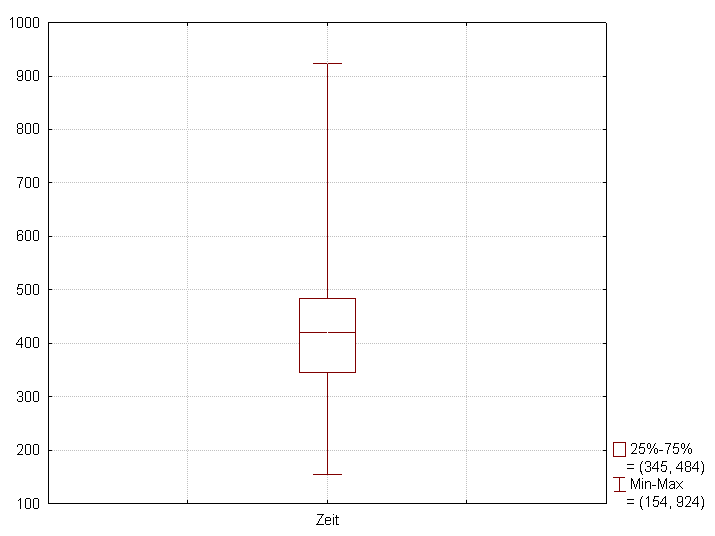
在統計學領域,Tukey有許多貢獻,例如盒狀圖(box plot),或稱為盒鬚圖(box-and-whisker plot)。

Box-Plot mit Min-Max Abstand.png

https://en.wikipedia.org/wiki/Box_plot


除了統計學,Tukey還有許多特別的貢獻,例如他發明了資訊方面的新字「Software」(軟體)和「bit」(位元)。

此外,對於訊號處理領域知名的快速傅利葉轉換(Fast Fourier Transform, FFT)來說,Tukey和庫利(James William Cooley, 1926-2016)一起提出了Cooley-Tukey FFT algorithm,是一大貢獻。

統計學家可以與不同領域的學者交流,透過花時間溝通與了解,幫助他們解決統計方面的問題,因此Tukey有一句名言

"The best thing about being a statistician is that you get to play in everyone’s backyard."
作為一名統計學家最棒的一件事,就是你可以去每個人的後院玩耍。

參考資料:

John Wilder Tukey 1973 | National Medal of Science - Mathematics And Computer Science

2021/7/12

Statistics 這個英文字不只是統計學?也是統計量!

談到統計學,對應的英文字自然是Statistics。如果你與我一樣,在讀英文的統計學時讀到Statistics這個字,可是從上下文看來,它指的不是學科、不是統計學這個領域,然後百思不得其解🙄

恭喜你發現英文世界的奧妙!😄 Statistics不只是統計學!

STATISTICS 也可以是統計量!

哇,這樣不是很容易搞混意思嗎?沒錯!所以看英文時要掌握文章脈絡(context,上下文),特別是單複數型態。

先從單數型態來看,statistic這個字是一個統計量(統計值),是可數的,因此它不只可以是一個,也可以是兩個、三個、多個,所以在複數型態時要加上s,因此,就變成了statistics,表示兩個以上的統計量!

所以,單數的statistic前面要加a表示一個,而文法上是單數型態,而statistics則數複數型態,例如:

A statistic is a random variable. (一個統計量是一個隨機變數)

Properties of statistics include completeness, consistency, sufficiency, ... (統計量的屬性包括了完備性、一致性、充分性...) (改自Wikipedia)

回到統計學的部分,就如同其他學科,後面接的字是第三人稱單數型態的be動詞或動詞(加s),例如:

Statistics is a science of analysis (統計學是分析的科學)
Statistics deals with data. (統計學處理著資料)

所以,statistic是只統計量,而statstics除了看上下文,只要清楚句子中的動詞,複數的話就是指好幾個統就量,單數的話通常是指統計學,如此一來,這兩種中文的意思就不難分辨囉!

最後稍微介紹一下統計量,由於統計量是用在統計而不是普查,因此不是直接用在母體(population),而是用在樣本。根據維基百科,統計量就是樣本統計量(sample statistic)

舉例來說,樣本平均數x̅,就是一個統計量。

關於統計量的更多介紹,未來有機會再整理,這個分享就先到這邊囉~

References:

Statistic (Wikipedia)

Basic Statistical Terms 統計學基本名詞 (StudyBME)

2020/9/21

R Programming Language - Run R Script

To run R script, install RStudio.

Add a new R script file and save it as a *.R file.


The code in the new script file can be:

a = 1

b = 2

a+b

When executing the script file, move the cursor to the first line of the script.

Press the run button, one line is run and the cursor is moved to the next line.

In the above example, press the run button three time for the three lines as below:


Related Information:

Installation and basic R commands

R programming language - load and save data

2020/9/3

R programming language - load and save data

This article explains the commands to load and save R data.

Firstly, declare data x:

    x = c(1,2,3,4,5,6)

Get the local path: getwd()

    path = getwd()

Change path:

    pathnew = file.path(path,"Desktop")

Set the local path: setwd()

    setwd(pathnew)

Save

    filename = file.path(pathnew,"test.RData")

    save(x,file=filename)

Clear workplace

    rm(list=ls())

Load

    filename = file.path(getwd(),"test.RData")

    load(filename)

    > x

    [1] 1 2 3 4 5 6

Related Information:

How to save and run an R Script

Installation and basic R commands

2020/8/18

Installation and Basic R commands

The R Project for Statistical Computing software is available with multiple operating systems such as Windows, MacOS.

It may be downloaded here:

https://www.r-project.org

After installation, try declare values with '=' or '<-' and see the average result with 'mean' function.

> x<-c(1,2,3,4,5)

> mean(x)

[1] 3

> y<-c(2,3,4,5,6,7,8)

> mean(y)

[1] 5

> z=c(5,6,7)

> mean(z)

[1] 6

Result:

To remove the above warning messages, open terminal and type:

defaults write org.R-project.R force.LANG en_US.UTF-8

Reference:

[記宅] 在 Mac 上安裝 R 語言 (R Studio, R) 新手介紹

Related Information:

R programming language - load and save data

How to save and run an R Script

2020/8/1

Hypothesis Testing 假設檢定名詞

hypothesis testing 假設檢定/假說檢定

null hypothesis 虛無假設 H0
alternative hypothesis 對立假設 H1/Ha

analysis ovariances (ANOVA) 變異數分析

E.g. 3 groups with one-way ANOVA
H0: μ1 = μ2 = μ3
H1: μ1 ≠ μ2 ≠ μ3

ANOVA的重點,是求F值:

F =MST/MSE = Mean Square Treatment/Mean Square Error

再和Critical Value CV=f(df1,df2)比較,CV可查f分佈表求得,當F值大於CV時,則拒絕H0

F值表示組間變異(variability between groups)較組內變異(variability within groups)多F倍,因此當F值越大,機率上組間的差異就越大,所以當F值增加至大於CV值時,組間有顯著異。

當F > CV時,組間有顯著差異,但不知道差異是在哪些組之間,因此需要事後檢定(post hoc test)

接著求p value,即在
可針對不同的α值查表求fα(df1,df2),例如f0.05(df1,df2)和f0.01(df1,df2)等數值,即可粗略地得知p值所落在的範圍


p value:
<0 ---="" .05="" br=""><0 ---="" .01="" br=""><0 ---="" .001="" br="">
<0 ---="" .05="" br=""><0 ---="" .01="" br=""><0 ---="" .001="" br="">p<0.05 ---  *     statistically significant
<0 ---="" .05="" br=""><0 ---="" .01="" br=""><0 ---="" .001="" br="">p<0.01 ---  **    statistically highly significant
<0 ---="" .05="" br=""><0 ---="" .01="" br=""><0 ---="" .001="" br="">p<0.001 --- *** statistically extremely significant
<0 ---="" .05="" br=""><0 ---="" .01="" br=""><0 ---="" .001="" br="">
test statistic 檢定統計量

significance level / level of significance 顯著水準 (通常α = 0.05)
- H0發生的機率、拒絕H0的機率、Type I error的機率(不太可能發生)

References

顯著水準 - 基礎統計名詞介紹網頁
Statistical significance (Wikipedia)
Foundations of ANOVA – Assumptions and Hypotheses for One-Way ANOVA (12-3) (Research By Design YouTube)
Mathematical statistics with applications in R, Ramachandran & Tsokos, 2nd edition (2015), p501,

Finding the P-value in One-Way ANOVA (YouTube)

p值的迷思:顯著與非常顯著 研究生2.0

2019/6/5

Excel - Histogram with Standard Deviation Error Bars 直方圖與標準差

The method of drawing the standard deviation range on a histogram in Excel 2019 is shown as below:
使用Excel 2019繪製直方圖與標準差的方法如下:


另外如果最後一個項目是平均值,想要只在它的上面加入標準差的話,以上圖為例,可以將上表前面A, B, C的Standard Deviation項目設定為0,而最後的D的儲存格E3內仍有數值即可。

2016/11/17

Central Limit Theorem (CLT) 中央極限定理

When
population mean = μ
population variance = σ2

random sample of size n
random samples: X1, X2, ..., Xn,

z-score/z-value/standard score z分數/標準化值 (Wikipedia/維基百科)

sum of samples/sample sum 樣本和 Sn = (X1 + X2 + ... + Xn) = ΣXi where i = 1 to n
sample mean 樣本平均數 = (X1 + X2 + ... + Xn)/n = Sn/n
sample variance 樣本變異數 s2
sample standard deviation 樣本標準差 s
sample size n

if σ is known:

Z = ( - μ)/(σ/√ n) = (Sn - n)/σn

When n → ∞ (n >= 30),

Z ~ N(0, 1)

One special case of gamma distribution:
chi-square distribution 卡方分布 (χ2) α = v/2 or n/2, β = 2 for gamma distribution.

χ2 = (n - 1)s22 with n-1 degrees of freedom.

if σ is unknown and n is large:

sσ

Student t-distribution/Student's t-distribution 學生t分布
t-distribution t分布

T = ( - μ)/(s/√ n)  with n-1 degrees of freedom.

t-table:
row: probability α at tα
column - degree of freedom

參考資料

Essentials of Probability & Statistics for Engineers & Scientists (Walpole at el.),機率與統計 (繆紹綱譯,滄海2013),p201, 242-248

機率與統計 (陳鍾誠網站)

Mathematical statistics with applications in R, Ramachandran & Tsokos, 2nd edition (2015), p162-164, 191-194

Student's t-distribution (Wikipedia)

2016/11/16

Normal Distribution 常態分布/常態分配

normal distribution 常態分布/常態分配
Gaussian distribution 高斯分布

bell-shaped 鐘形

If random variable X has a normal distribution N(μ,σ2),
the probability density function (pdf) of X is:

f(x) = [1/√(2πσ2)]exp[-(x-μ)2/2σ2]

=====

Excel formulas:

NORM.DIST(X, μσ, cumulative)

if cumulative = true => cdf
if cumulative = false => pdf

=====

Z-score/Z-value/Z-transform/standard score z分數/z轉換/標準化值 (Wikipedia/維基百科)
How to get the Z-tansform from normal random variable X:
Z = (X - μ)/σ where μ = population mean and σ = populaiton variance

Z 是N(0,1) 的標準常態分布

(Note: The Z-transform used in statistics is not the Z-transform used is digital signal processing. 此處的Z轉換與數位訊號處理DSP中的Z轉換不同)

standard normal probability distribution 標準常態機率分布 N(0,1)
mean μ = 0 and variance σ2 = 1

======

Excel Formula:

Z = STANDARDIZE(X, μ, σ)

Inverse Z ie get Z score with known cumulative probability (area under curve):
e.g. α=5% => Zα/2 = NORM.INV(1-α/2, μ, σ) = NORM.INV(1-2.5%, 0, 1) since μ = 0 and σ = 1 for the standard normal distribution.

======

If X1...Xn are normally distributed as N(μ,σ2),
ΣZi2 = Σ((X - μ)/σ)2 is a χ2 distribution with n degrees of freedom.
ΣXi2 is a χ2 distribution with n degrees of freedom.

參考資料

Essentials of Probability & Statistics for Engineers & Scientists (Walpole at el.),機率與統計 (繆紹綱譯,滄海2013)

Mathematical statistics with applications in R, Ramachandran & Tsokos, 2nd edition (2015), p188

2016/11/10

Sampling Schemes 抽樣方法

抽樣方法可分為:
隨機抽樣
非隨機抽樣

隨機抽樣
simple random sampling 簡單隨機抽樣 - every element may be selected with equal chance
systematic sampling 系統抽樣/系統性抽樣 - every Kth element, e.g, 3, 10, 17, 24, ... (K=7)
stratified sampling 分層抽樣 - e.g. student age, university, major
cluster sampling 部落抽樣/叢集抽樣
multiphase sampling 多相抽樣 multistage sampling 多段抽樣

非隨機抽樣
convenience sampling 偶遇抽樣/方便抽樣
quota sampling 配額抽樣/定額抽樣
purposive sampling 主觀抽樣 / judgmental sampling 立意抽樣
snowball sampling 滾雪球抽樣

validity 效度

參考資料

Essentials of Probability & Statistics for Engineers & Scientists (Walpole at el.),機率與統計 (繆紹綱譯,滄海2013), p8

Mathematical statistics with applications in R, Ramachandran & Tsokos, 2nd edition (2015), p8-12

統計學-李柏堅-第01章:抽樣 (CUSTCourses影片)

Mean, Variance and Standard Deviation 平均數、變異數、標準差

mean 平均數
standard deviation 標準差

population mean 母體平均數 μ = Σxi /N = (x1+x2+...+xN)/N, where i = 1 to N
population variance 母體變異數 σ= Σ(xi - μ)2/N, where i = 1 to N
population standard deviation 母體標準差 σ

sample mean 樣本平均數 = Σxi /n = (x1+x2+...+xn)/n, where i = 1 to n
sample variance 樣本變異數 s2 = Σ(xi - )2/(n - 1), where i = 1 to n
sample standard deviation 樣本標準差 s

Note:
求標準差時只要將變異數開根號即可
σ2 s2的分母不同,母體變異數 σ的分母是N(或n),樣本變異數 s2的分母則是n - 1

Excel Formulas:

mean - AVERAGE()

population variance - VAR.P()
sample variance - VAR.S()

population standard deviation - STDEV.P()
sample standard deviation - STDEV.S()

參考資料

Population Mean and Sample Mean

Sample Standard Deviation vs. Population Standard Deviation

統計學-李柏堅-第01章:標準差 (CUSTCourses影片)

Mathematical statistics with applications in R, Ramachandran & Tsokos, 2nd edition (2015), p26-27

2016/11/3

Moment-Generating Function 動差生成函數/力矩產生函數

Mx(t) = E(etx) = Expected value of exponential function exp(tx).

Mx(t) = 1 + E[1 + tX + (tX)2/2! + ... + (tX)n/n!

Derivatives of the moment-generation function with t=0:

Mx(n)(0) = E[Xn],         n = 1, 2, 3, ...

first moment - mean 平均數

second moment - variance 變異數

third moment - skewness 偏度/歪度/偏態

fourth moment - kurtosis 尖度/峰度

參考資料

動差生成函數 (Moment Generation Function) (陳鍾誠網站)

Mathematical statistics with applications in R, Ramachandran & Tsokos, 2nd edition (2015),  p96-100 (Section 2.6)

2016/10/23

Probability Distribution Terms 機率分布名詞

random variable 隨機變數
sample space 樣本空間 S

probability distribution 機率分布/機率分配
sampling distribution 抽樣分布

normal population 常態母體

statistic 統計量
sample statistic 樣本統計量
sample mean 樣本平均數
sample variance 樣本變異數 

discrete probability distribution 離散機率分布
probability mass function (pmf) 機率質量函數
probability function 機率函數

continuous probability distribution 連續機率分布
probability density function (pdf) 機率密度函數 - total area under pdf curve = 1
density function 密度函數
continuous uniform distribution 連續均勻分布

cumulative distribution function (cdf) 累積分布函數 - 離散及連續皆有cdf

expected value/expectation 期望值
conditional expectation 條件期望值

uniform probability distribution 均勻機率分布
normal probability distribution 常態機率分布/常態機率分配 N(μ,σ2)
normal distribution 常態分布 / Gaussian distribution 高斯分布
standard normal probability distribution 標準常態機率分布 N(0,1) (mean μ = 0 and variance σ2 = 1)

Z-score/Z-value/Z-transform/standard score z分數/z轉換/標準化值 (Wikipedia/維基百科)
How to get the Z-tansform from normal random variable X:
Z = (X - μ)/σ where μ = population mean and σ = populaiton variance

Z 是N(0,1) 的標準常態分布

(Note: The Z-transform used in statistics is not the Z-transform used is digital signal processing. 此處的Z轉換與數位訊號處理DSP中的Z轉換不同)

normal probability distribution 常態機率分布 can be represented as N(μ, σ2).
standard normal probability distribution 標準常態機率分布 can be represented as N(0, 1).

binomial probability distribution 二項機率分布
Bernoulli 柏努利/白努力/貝努力
moment-generating function 動差生成函數/力矩產生函數

negative binomial distribution 負二項分布
geometric distribution 幾何分布
hypergeometric distribution 超幾何分布

Poisson probability distribution 卜瓦松機率分布
Poisson approximation 卜瓦松近似/瓦松近似逼近

Log-normal distribution 對數常態分布

gamma probability distribution 伽瑪機率分布 (uppercase gamma character: Γ)
Two parameters:
α - shape parameter
β - scale parameter

μ = αβ
σ2 = αβ2

exponential probability distribution 指數機率分布
chi-square distribution 卡方分布 (χ2)
degrees of freedom 自由度 v or n or df

Special cases of gamma distribution:
exponential distribution => α = 1
μ = β
σ2 = β2

chi-square distribution => α = v/2, n/2 or df/2, β = 2
μ = v or n (degrees of freedom)
σ2 = 2v or 2n

Erlang distribution 厄朗分布/厄蘭分布/艾朗分布

Beta distribution 貝他分布

joint probability distribution 聯合機率分布
joint probability mass function (joint pmf) 聯合機率質量函數 (discrete X and Y random variables)
joint probability density function (joint pdf) 聯合機率密度函數 (continuous X and Y random variables)

marginal distribution 邊際分布

conditional probability distribution 條件機率分布

bivariate distribution 二元分布/二變量分布/雙變數分布

Student t-distribution/Student's t-distribution 學生t分布
t-distribution t分布

Weibull distribution 威布爾分布/韋布林分布/韋氏分布/魏普分布

參考資料

Mathematical statistics with applications in R, Ramachandran & Tsokos, 2nd edition (2015)
Essentials of Probability & Statistics for Engineers & Scientists (Walpole at el.),機率與統計 (繆紹綱譯,滄海2013),p155, p174-181
國家教育研究院雙語詞彙、學術名詞暨辭書資訊網
機率與統計:動差生成函數 (Moment Generation Function) (陳鍾誠網站)
Wikipedia

2016/9/29

Statistical Data Types 統計的資料種類

(1) 按數量計算或按種類區分的資料
quantitative data 定量資料/計量資料/量化資料/屬量資料
numerical data 數值資料
e.g. height, weight

qualitative data 定性資料/質性資料/屬性資料
categorical data 分類資料/類別資料
e.g. eye color, blood type

(2) 同一時間的不同資料或不同時間的相似資料
cross-sectional data 橫斷面資料
e.g. university rankings 2016:

2016
NameRank
University A1
University B2
University C3
University D4

time series data 時間序列資料/時序列資料

e.g. Global Open Data Index of Taiwan:

201320142015
#36#11#1

參考資料

Mathematical statistics with applications in R, Ramachandran & Tsokos, 2nd edition (2015), Chapter 1 pages 5-6.

國家教育研究院雙語詞彙、學術名詞暨辭書資訊網

Basic Statistical Terms 統計學基本名詞

在生醫工程研究中常需要運用到統計學
所以試著了解這方面的知識

probability 機率
statistics 統計/統計學

permutation 排列
combination 組合

statistic 統計量
統計量說明了樣本的特徵,可用來推估母體的參數

statistician 統計學家

sample 樣本/抽樣
population 母體
populations 母體群

descriptive statistics 敘述統計學 - 解釋樣本的資料特徵,例如一個班級學生的身高體重
inferential statistics 推論統計學 - 推估母體的資料特徵,例如全台灣某年級學生的身高體重
statistical inference 統計學推論
sampling distribution 抽樣分布

statistic 統計量
mean 平均數
median 中位數
mode 眾數

standard deviation 標準差
variance 變異數

standard error 標準誤差 (Wikipedia) 一個統計量的估計標準差,例如多個樣本平均數的標準差 (影片)

point estimate 點估計

interval estimate 區間估計
confidence interval 信賴區間

analysis of variances (ANOVA) 變異數分析

參考資料

Essentials of Probability & Statistics for Engineers & Scientists (Walpole at el.),機率與統計 (繆紹綱譯,滄海2013)

機率與統計 (陳鍾誠網站)

Mathematical statistics with applications in R, Ramachandran & Tsokos, 2nd edition (2015)

統計學-李柏堅-第01章:統計學的目的 (CUSTCourses影片)