Study BME (Biomedical Engineering) 生醫工程學習筆記
一些生物醫學工程方面的知識、相關資訊,包括統計學。 電機資訊相關資訊:
StudyEECC
聽力科技相關資訊:
電子耳資訊小站
2019/6/5
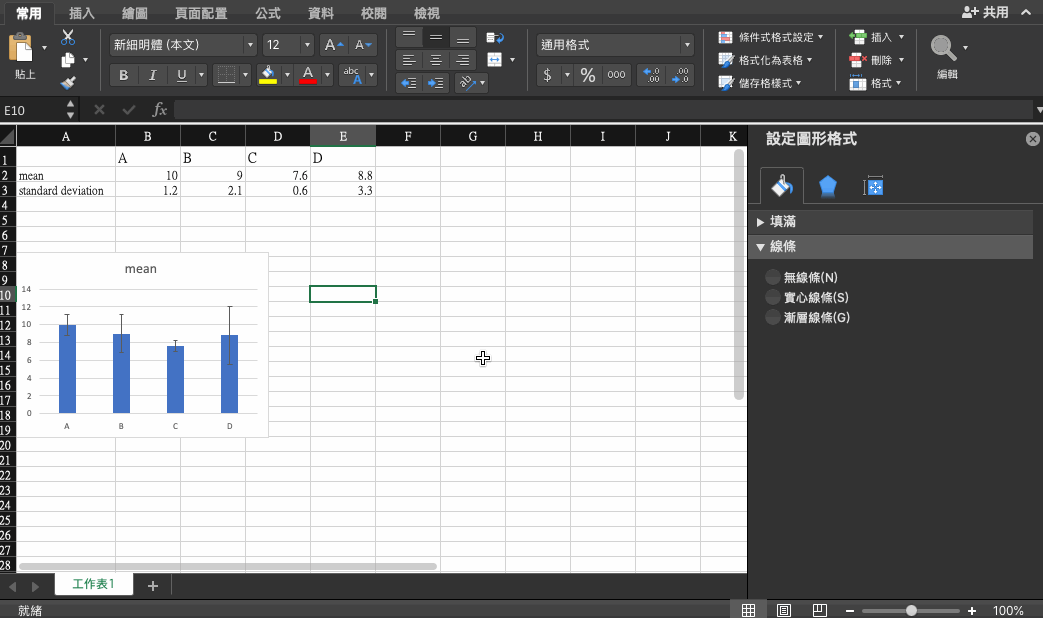
Excel - Histogram with Standard Deviation Error Bars 直方圖與標準差
The method of drawing the standard deviation range on a histogram in Excel 2019 is shown as below:
使用Excel 2019繪製直方圖與標準差的方法如下:
另外如果最後一個項目是平均值,想要只在它的上面加入標準差的話,以上圖為例,可以將上表前面A, B, C的Standard Deviation項目設定為0,而最後的D的儲存格E3內仍有數值即可。
沒有留言:
張貼留言
較新的文章
較舊的文章
首頁
訂閱:
張貼留言 (Atom)
沒有留言:
張貼留言